Creating Your First Dashboard
Step-by-step guide to creating your first dashboard in Dashbreeze.

Dashbreeze is built around a few simple ideas. Once you understand them, creating dashboards becomes easier.
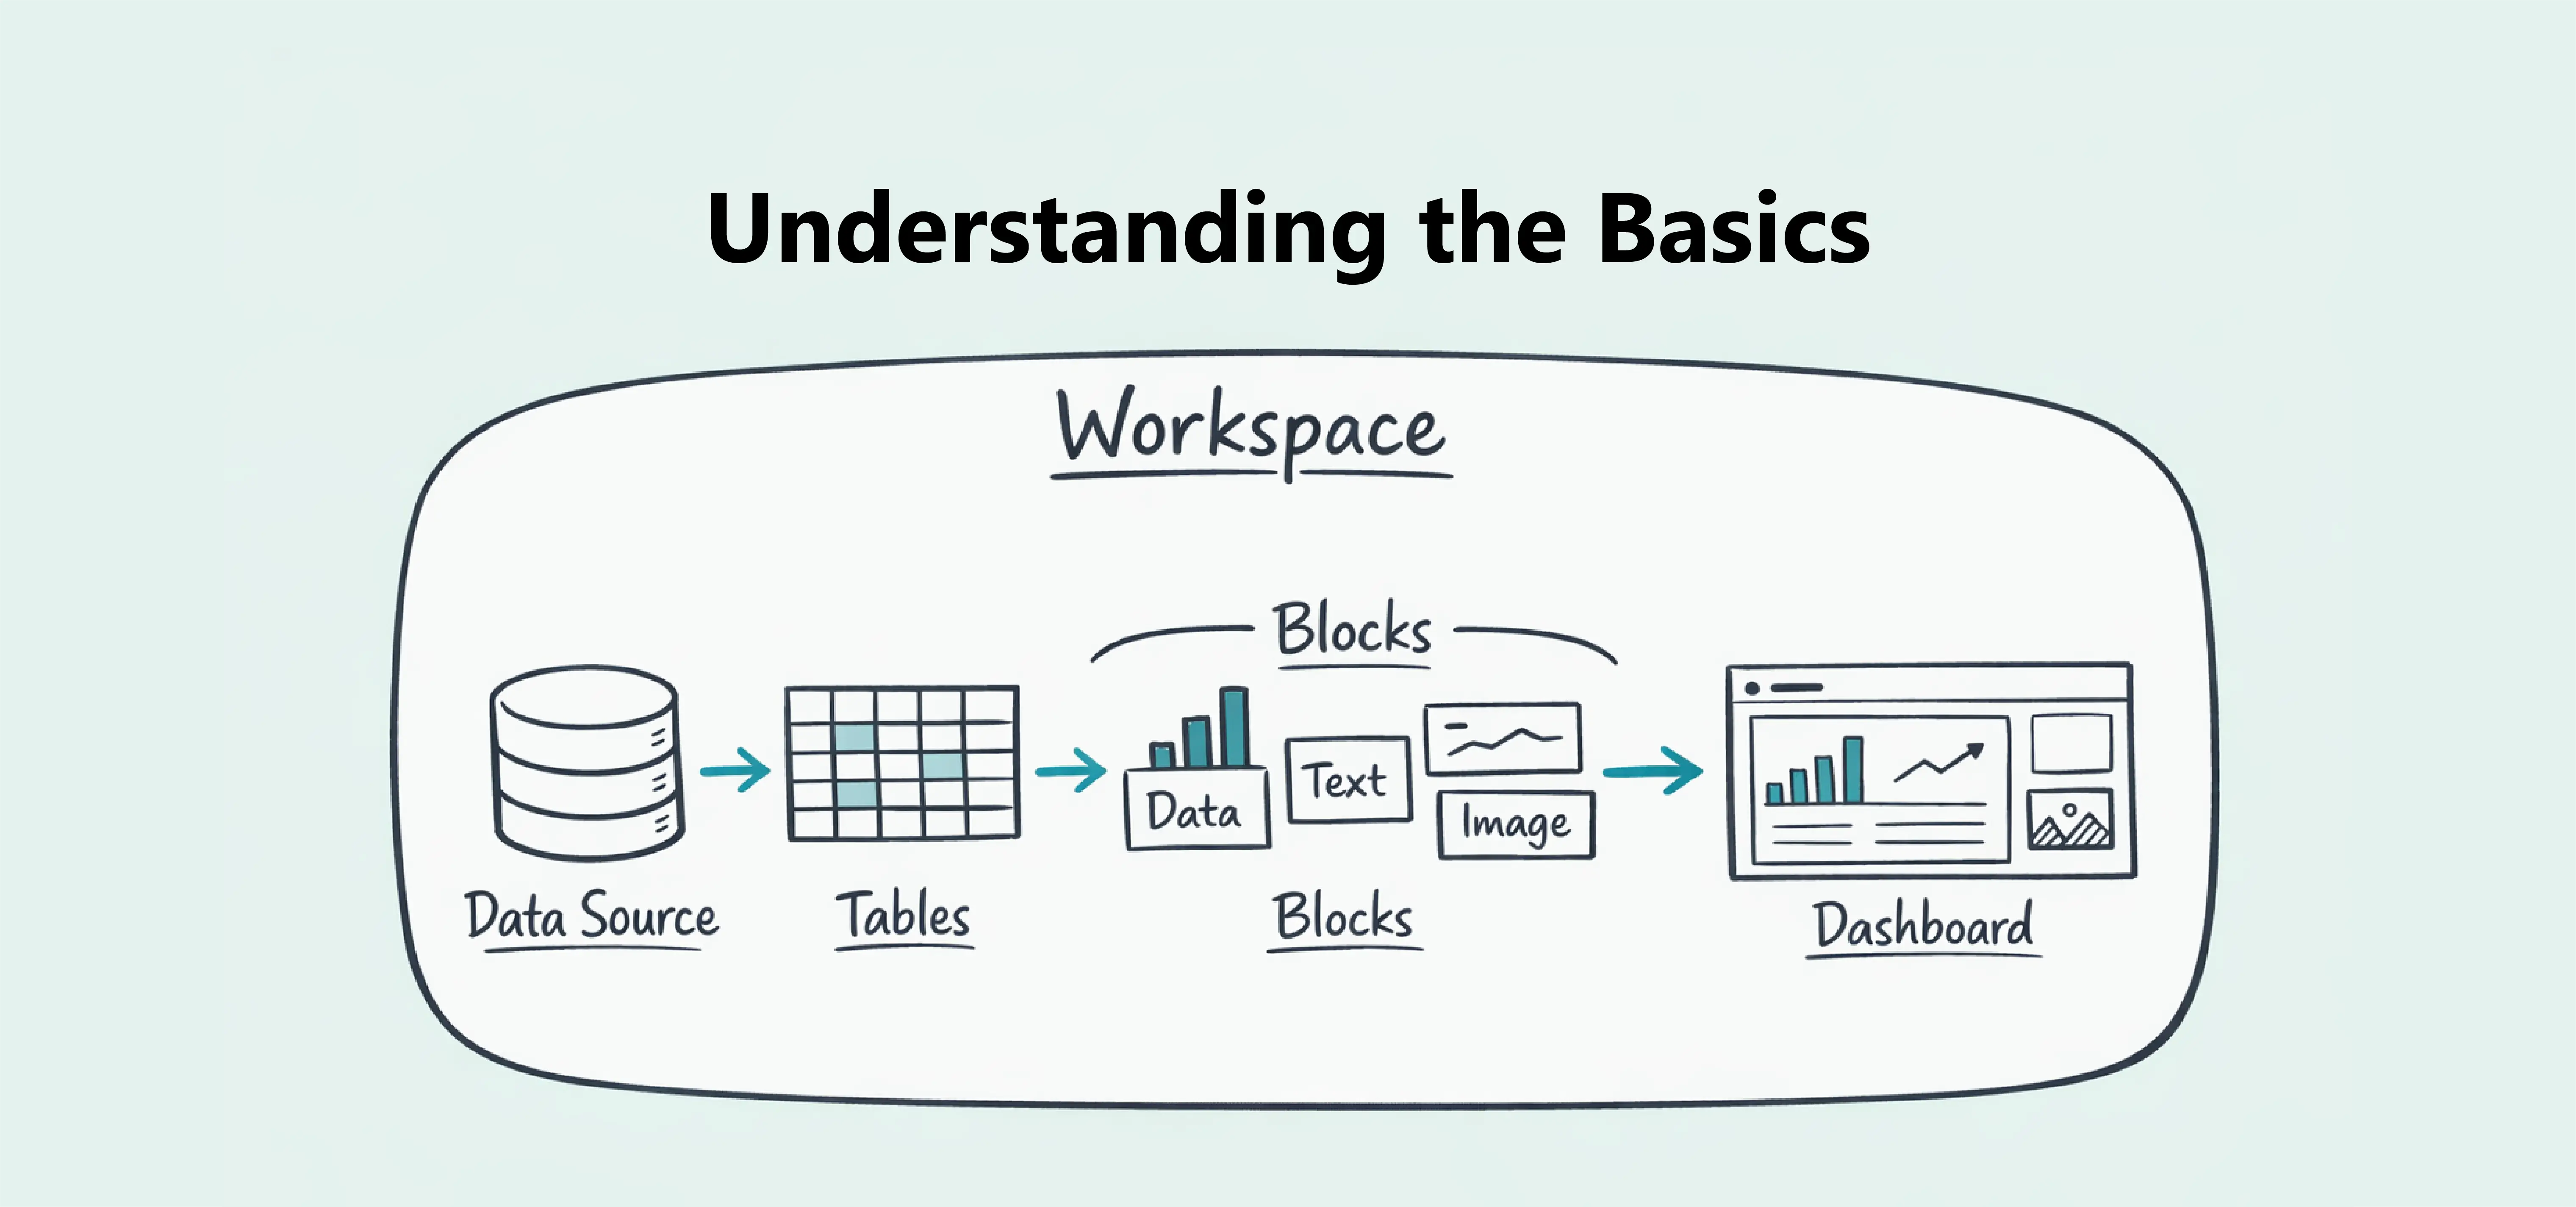
Think of Dashbreeze as a system that organizes data and turns it into dashboards. The main parts are workspaces, data sources, tables, and blocks.
A workspace is where all your work happens in Dashbreeze.
It groups everything you create, including dashboards, tables, and integrations. It also controls who can access and collaborate on your work.
A data source is where your data originally lives.
Dashbreeze can import or connect to data from external tools and files, making it available inside the platform.
When you connect a data source, Dashbreeze creates one or more tables that you can use in your dashboards.
Your original data stays in its source system. Dashbreeze uses a copy to power dashboards and visualizations.
Tables store your structured data in Dashbreeze.
Each table is made of rows and columns:
Tables make your data easy to read and ready to use in dashboards.
Blocks are the components you use to build dashboards.
Each block is a piece of content, such as data, text, or media. By combining blocks, you can create complete dashboards.
Data blocks are blocks that display information from your tables.
There are three types of data blocks:
Each data block uses one or more columns from a table to display information in a specific way.
You can add multiple data blocks to the same dashboard and even use the same table in different blocks to explore your data from different perspectives.
A dashboard is a layout of multiple blocks in one place.
Each block shows a part of your data or content. Together, they create a complete view.
You can move, resize, and customize blocks to organize your dashboard the way you want.
Dashboards can also include blocks connected to different tables, allowing you to combine multiple data sources in a single view.